Market Update – February 2021
08/02/2021Market Update – April 2021
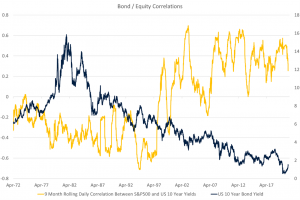
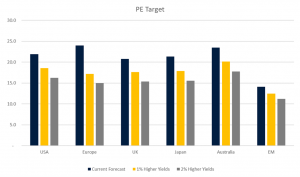
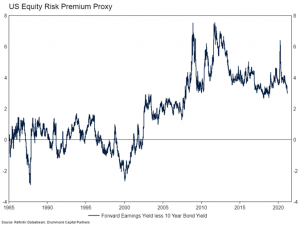
10/05/2021 The Relationship Between Bonds and Equities In the past fifty years, the relationship between bonds and equities has gone through two distinct phases. Until the mid-1990s, bond yields and equities were negatively correlated (moved in opposite directions). During this period, the economic cycle was primarily driven by inflation. If inflation rose, central banks were forced to increase interest rates[1], causing recessions and equity bear markets. The policy induced recession would then lead inflation to moderate, allowing interest rates to fall again and equity markets to recover. However, as central banks gained credibility (particularly after the 1980s recessions) and inflation moderated, the relationship switched. Since the mid-1990s, bond yields and equities have generally been positively correlated. In periods of substantial equity market weakness, the prices of bonds have risen as central banks have cut interest rates. The relationship between bond yields and equities is shown in the chart below. This change in the bond/equity correlation came as we moved from a world where central banks caused recessions by increasing interest rates in response to inflation to one where inflation has been largely absent and central banks have responded to recessions by cutting interest rates sharply. Yet there are periods, usually when interest rates are rising (blue line), where this relationship has broken down (when the yellow line falls). While we do not think we will return to the pre-1997 pattern (despite bond yields grinding higher in the years ahead), we think correlations between bonds and equities will not be as persistently negative as they have been. This poses an issue for portfolio construction as these two asset classes will no longer act as ballast to the other to smooth investment returns. Interest Rates and Long-Term Equity Valuations Equity markets have long been a significant beneficiary of the lower inflation regime, as it has allowed market multiples to expand under an environment of steady economic growth and low interest rates. The S&P500 has averaged the highest PE ratio when inflation averaged between 1% and 3% (which it has done around 30% of the time since 1900). As discussed in our last Market Update, risks are building that inflationary pressures drive interest rates beyond our forecast, which could act to compress market multiples if not met with commensurate increases in the rate of growth. We can assess the impact of changes in interest rates on equity markets using our capital market return framework. We use two methods of constructing long-term equity market valuations, an estimate of long-term fair value price to earnings ratios (PE) and also a price target derived using a dividend discount model. Using the average of these frameworks, we show below our current estimates of fair value long-term PE ratios (in blue). The current valuations are based on an increase in US interest rates to 2.7% over the next ten years (this is our “return to normal” SAA scenario). This is clearly a very low forecast profile for long-term interest rates, and this makes equity market valuations as a whole appear not overly expensive. As the baseline forecast for interest rates is quite low, it is helpful to use this framework to stress test these valuations under higher interest rate scenarios. If interest rates globally over our ten-year forecast horizon are two percentage points higher than we currently expect, the fair value PE ratio falls substantially (see below). From this process, we can calculate the sensitivity (or duration in bond language) of equity markets to changes in interest rates. For developed markets this is around 18, which means a 1% rise in interest rates (all else equal) would correspond with a ~18% fall in fair value. The sensitivity of emerging markets is a little less reflecting higher starting interest rates. This analysis assumes nothing else changes in the modelling. In reality, if we forecast higher interest rates, we would likely also forecast stronger growth, which would act as an offset in the valuation. Indeed, in our modelling a 1 percentage point increase in expected dividend growth would increase the fair value of the US market by around 30%. Another factor to consider would be the level of inflation. A higher inflation regime (to an average of between 3% – 5%) would subtract around 20% from the fair value of equities. What this means is that while equity market valuations for markets (outside the US) look generally attractive under our current forecasts, an increase in interest rates or inflation (without a corresponding increase in growth) would change this materially. To put this in context, we think the US and Australian equity markets are 30% expensive and 20% cheap respectively. A 1 percentage point increase in bond yields would make the US market around 50% expensive and take the Australian market back to fair value. Should We Expect a Repeat of the 2018 Bear Market? One of the ongoing potential risks we seek to manage against is a significant market correction should expectations for rising rates begin to extend beyond the markets comfort zone given already extended valuations. In last year’s 2021 Crystal Ball market update, we referred to the spread between the S&P500 earnings yield (the inverse of the PE ratio) and US interest rates as being important for markets. This spread is a reasonable short-term proxy for the equity risk premium (ERP). The ERP is the excess return investors demand for holding equities versus a risk-free asset. It represents the value of equities versus bonds. When the ERP is low, bonds are more attractive relative to equities. Below, we show this ERP proxy since 1985. The ERP proxy has risen structurally twice, following the Tech Bubble and the Financial Crisis. This increase reflects the fall in interest rates over the period. When at extremes, the ERP proxy also appears to be a signal of impending market stress. Prior to the 1987 Black Monday crash and bursting of the Tech Bubble, the ERP proxy had turned substantially negative. In both instances, the expected earnings yield from equities was around 3% below what could be earned investing in bonds. Prior to the Financial Crisis the ERP had narrowed, but wasn’t out of the realms of reasonableness. Twice in 2018, markets were tested (before substantially correcting late in the year) when the ERP proxy fell to post Financial Crisis lows. It is not certain whether the fall in the ERP in these instances was the direct cause of the equity market correction, but mathematically the fall implies an improvement in the relative valuation of bonds versus equities. It is not hard to imagine that once equity valuations stretch to unappealing levels, that could either trigger an equity market correction or exacerbate one already in train. Since around the middle of last year global bond yields have risen in response to stronger growth prospects, seeing the ERP proxy narrow again. Recently, equity markets have come under pressure as the increases in bond yields have escalated, with the S&P500 falling around 6%. With yields pushing higher on re-opening economies and massive fiscal stimulus, the ERP will likely fall further in the second half of the year. A key question is if a narrowing in the ERP to levels seen in 2018 (or lower) will lead to another substantial equity market correction. We don’t think it will. In previous instances (1987, 2000, 2018), central banks were tightening monetary policy and growth was slowing. Now, monetary policy is widely anticipated to be very accommodative for the next few years and economic growth is accelerating substantially. This will likely provide some comfort for equity markets and prevent a major sell-off. Nevertheless, equity markets will be sensitive to rising rates. Our expectation is that the US 10-year yield heads above 2% (where it sat prior to Covid) in the second half of this year. This will make bonds more attractive relative to equities and should drive some portfolio reallocation from multi-asset investors. If the increase in yields is as sharp as we have seen in previous months, it will more than likely be accompanied by moderate equity market weakness. However, we do not expect a bear market driven by higher interest rates (as in 2018) unless central banks move to a tightening bias (which is a credible risk) or lose control of monetary policy (which is very unlikely). [1] Note, the price of a bond rises when interest rates fall and falls when interest rates rise. Generally, in this document we will refer to interest rates rising or falling, as that is the normal market convention. The information contained in this Market Update is current as at 15/03/2021 and is prepared by Drummond Capital Partners ABN 15 622 660 182, a Corporate Authorised Representative of BK Consulting (Aust) Pty Ltd (AFSL 334906). It is exclusively for use for Drummond clients and should not be relied on for any other person. Any advice or information contained in this report is limited to General Advice for Wholesale clients only. The information, opinions, estimates and forecasts contained are current at the time of this document and are subject to change without prior notification. This information is not considered a recommendation to purchase, sell or hold any financial product. The information in this document does not take account of your objectives, financial situation or needs. Before acting on this information recipients should consider whether it is appropriate to their situation. We recommend obtaining personal financial, legal and taxation advice before making any financial investment decision. To the extent permitted by law, Drummond does not accept responsibility for errors or misstatements of any nature, irrespective of how these may arise, nor will it be liable for any loss or damage suffered as a result of any reliance on the information included in this document. Past performance is not a reliable indicator of future performance. This report is based on information obtained from sources believed to be reliable, we do not make any representation or warranty that it is accurate, complete or up to date. Any opinions contained herein are reasonably held at the time of completion and are subject to change without notice.Will Bonds Break Equities?