Market Update – October 2023
24/10/2023
Affinity Insights – Issue 23, December 2023
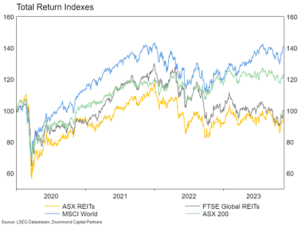
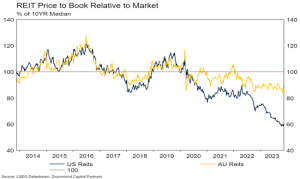
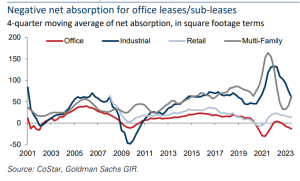
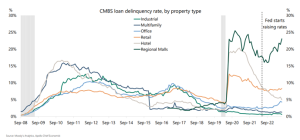
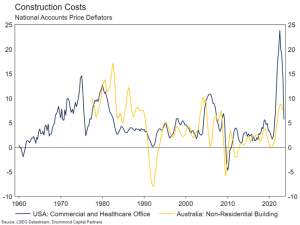
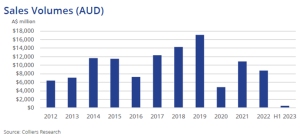
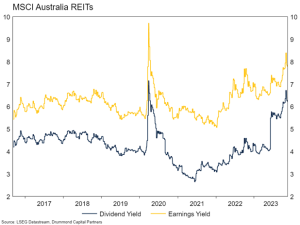
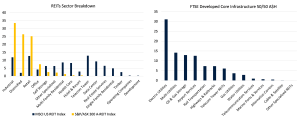
18/12/2023Key Points: What do people mean when they talk about investing in real assets? What makes owning a slice of a building or gas pipeline different from owning a slice of a bank or a retailer? At a high level, there are several reasons for the distinction. These assets tend to have long-term contracted or regulated cash flows. Good office buildings feature long-term weighted average lease lengths. Toll roads often have price increases linked to inflation. Energy pipelines can feature take or pay contracts. Additionally, these assets also tend to be capital intensive. This embeds a certain replacement cost into the value of the asset, which can be an effective hedge against inflation. The underlying assets comprising the relevant indexes for each asset class are also quite diversified at a sectoral level. REITs (particularly global) have diversified exposure to offices, retail, industrial, telecoms/data and residential buildings. Infrastructure includes utilities, energy transport, airports, toll roads and rail. In 2021[1], we reviewed property and infrastructure in detail, decomposing their long-term return drivers into separate macroeconomic factors. This month we take more of a tactical view, reviewing the prospects for property in the period ahead. Early next year we will focus on the tactical outlook for infrastructure. Recent Performance After underperforming during 2020 due to lockdowns and travel restrictions, rising interest rates since 2022 have hit property hard. The other side of this coin is that poor returns have improved valuations somewhat. While this does not mean a lot from a tactical perspective, these assets are generally trading at a reasonable price discount relative to the broader market. The price to book ratio of US REITs compared to the wider US market is only around 60% of the ten-year median. Australian REIT valuations have improved but are much closer to the long run average. Headwinds and Tailwinds Whether this valuation discount has a chance to express itself in the form of excess returns will depend in large part on whether the headwinds to the sector have dissipated. The ratio of people to cake has improved significantly. The return to the office push from corporates since 2022 has managed to drag office occupancy up to around 50% of pre-Covid levels in the USA. However, occupancy has been floating around that rate for around the past year, so it is probably safe to say that this represents a new-normal for the sector. The story in Australia is better, with occupancy around 70% of pre-Covid levels, though measurement differences could account for much of the gap. However, for obvious reasons this low rate of occupancy has not resulted in a 50% collapse in office demand. The US office vacancy rate (unoccupied office space rather than unoccupied desks) rose to 13.3% in the September quarter, around four percentage points above the long-term average. This is high, but not unprecedented – 2001 featured a similar vacancy rate. While there is some flex generated by universally hated hot-desking, corporates do not generally lease office space on a per-person, per-day basis. Different people and teams work on different days, and this has muted the net impact of low office occupancy. The chart below shows the net-demand for US REIT leases. While net demand for office has fallen more than in the financial crisis, it is a far cry from what straight occupancy would imply. It will take time for the next effect of the supply and demand balance to wash through the market. It is common for a lease to last 5-10 years and in practice that means a little bit of space is probably given up each year in aggregate until a new steady state is reached. In line with this, we think demand will remain a headwind to the sector in the years ahead. Another concern in the wider property sector is the impact of higher interest rates on commercial real estate lending in the USA. So far, contrary to quite negative headlines, the sector has absorbed higher rates relatively well. Likely due to the strength of the economy, troubled maturing loans are being restructured or extended so as to prevent widespread defaults. Default rates for office asset backed securities have crept up, but still remain low by historic standards. Charge off rates (bad debt provisions) for commercial real estate bank loans have risen a little (0.13% in the September quarter), but are well below the 2%+ per quarter experienced in the Financial Crisis or the 1990s recession. Still, banks have materially tightened lending standards towards the sector, investors are demanding a higher risk premium to lend against these assets, and roughly 15% of the total stock of loans will need to be refinanced next year, potentially into a deteriorating economic environment. Assuming interest rates stay higher for longer, rolling the current stock of real estate debt over the next year will continue to be a challenge for the sector. Transaction volumes are also very low, as spreads between seller and buyer valuation expectations remain wide. While the outlook for demand and financing is negative, there is a bright spot for real estate – the replacement value of the assets. Anyone who has tried to build or renovate a residence in the past two years would be uncomfortably familiar with how expensive it is to get building work done now. Commercial property is no exception. The price deflator for commercial office construction (basically the cost to build) in the USA is around 40% higher than it was in 2020. Non-residential building construction costs in Australia have risen nearly 20%. This increased cost of construction has functioned as a hedge against higher interest rates and has proved its aforementioned inflation hedging characteristics. Unless construction costs fall substantially, (which has never happened absent a significant recession, and even then, is not guaranteed), the high replacement cost for property assets puts a natural floor under valuations, despite the poor outlook for demand and refinancing problems. Value vs “Book Value” As mentioned above, transactions in the commercial property market have basically ground to a halt. The chart below shows Australian commercial property sales volumes. The story is similar for the USA. Asset owners do not want to realise the lower asset values buyers are now prepared to pay given higher interest rates. This has led to something of a valuation gap between the marked book value of assets and the market valuation of the listed REITs which hold them. While not exactly an apple for apples comparison, the yields on unlisted and listed property has diverged. Australian office space (at an individual asset level) has risen by around a percentage point. However, the earnings and dividend yield of listed REITs (which include retail, industrial etc) have risen multiples of that. In line with this, we think the pricing of listed REITs represents a much more complete realisation of the risks associated with investing in property than unlisted funds. Portfolio Positioning There are headwinds and tailwinds to the property asset class. Valuations look cheap relative to history and especially cheap relative to replacement costs. However, lots of people are still completing their TPS reports from home rather than the office and occupancy is not rising much from here. There is still stock coming on the market and labour markets are softening, suggesting vacancy rates will continue to rise. The refinancing environment is ugly given high interest rates, but as long as asset owners can extend and pretend, buildings do not need to be sold and discounts to book value do not need to be realised. Given the above, we are currently neutrally positioned from a tactical perspective. In addition, the exposure to property we have is global, which is more diversified than Australian property and the Fund we have allocated to has less office exposure than the benchmark. [1] https://www.drummondcp.com/insights/sunset-for-reits-infrastructure This is prepared by Drummond Capital Partners (Drummond) ABN 15 622 660 182, AFSL 534213. It is exclusively for use for Drummond clients and should not be relied on for any other person. Any advice or information contained in this report is limited to General Advice for Wholesale clients only. The information, opinions, estimates and forecasts contained are current at the time of this document and are subject to change without prior notification. This information is not considered a recommendation to purchase, sell or hold any financial product. The information in this document does not take account of your objectives, financial situation or needs. Before acting on this information recipients should consider whether it is appropriate to their situation. We recommend obtaining personal financial, legal and taxation advice before making any financial investment decision. To the extent permitted by law, Drummond does not accept responsibility for errors or misstatement of any nature, irrespective of how these may arise, nor will it be liable for any loss or damage suffered as a result of any reliance on the information included in this document. Past performance is not a reliable indicator of future performance. This report is based on information obtained from sources believed to be reliable, we do not make any representation or warranty that is accurate, complete or up to date. Any opinions contained herein are reasonably held at the time of completion and are subject to change without notice. .Out of Office
 Source: LSEG Datastream, Drummond Capital Partners